
Replica's Special Events Hub
Data For Event Planning
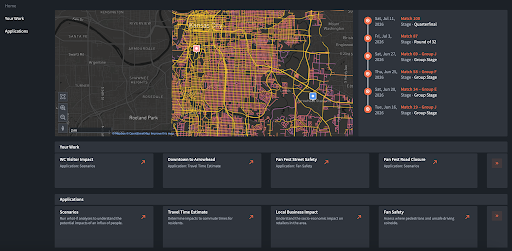
We recently launched Replica's Special Events Hub, a customizable suite of planning tools designed to help cities prepare for large-scale events. Built on Replica's data and operational systems, the Hub brings together mobility, safety, infrastructure, and crowd dynamics insights into one collaborative workspace tailored to each location’s needs
Fill out the form to get in touch with our team and learn more!
Replica Hosted a Webinar with World Cup Cities where we:
- Demo'ed the Special Events Hub
- Walked through real life use cases with WSP and MBI
- Discussed Customization for each city
- Reviewed the data driving the model
FAQs
Early FAQs from World Cup Host Cities
Q: Is the Special Events Hub available to everyone?
A: Yes! The Hub is configurable for any city, guided by unique local needs, involved partner organizations, and subscription and budget capacity.
Q: How will the Hub change over time?
A: As host cities progress through the planning process, bring in additional partners, and learn about emerging priorities, the applications within their hub can evolve to match. While Replica’s core models and data will remain solid, we’ll be working alongside you to update which questions you can ask and which collaborative features are available.
Q: Does the hub include the representation of freight vehicles and delivery trips?
A: Yes—Replica models freight in multiple classifications. We can incorporate this into the planning tools wherever relevant; we’ll also begin exploring the specific questions each city is asking around freight and determine if it would be valuable to automate internal or externally-facing freight updates.
Q: Can you zoom in to intersection-level turning movements or lane-level traffic analysis?
A: Yes, Replica supports high-resolution analysis, including lane-level and single or bi-directional insights.
Q: Can you view travel time by mode (not just car)?
A: Yes—travel time can be segmented by mode, similar to other Replica tools.
Q: Can the road closure app now simulate lane reallocation (e.g., replacing car lanes with bus lanes)?
A: Yes—road closure scenarios within Replica allows for simulating shuttles, transit-only zones, and modal prioritization.
Q: What variables are used to estimate a safety risk score?
A: In general, the risk model represented in Replica’s Special Event Safety tool combines Replica’s multimodal and demographic data with driving event indicators like phone use, harsh braking, and rapid acceleration. This said, risk scores can be customized by customer to match local practices and can be absolute or relative to a given geographic area.
Q: What data powers the real-time dashboard?
A: A mix of Replica’s multimodal models, connected driver data, and event-specific overlays powers the real-time dashboard, but this can be customized for specific use cases.
Q: Does Replica capture drayage freight trips?
A: We do model short-distance freight trips, but we don’t make a distinction between drayage and non-drayage in our current models. This is something we’ll begin to explore as we build out additional freight capabilities. Stay tuned!
Q: Is this suite of applications built on the Seasonal Mobility Model? Will documentation be available?
A: These applications all draw from the Seasonal Mobility Model, with enhancements. Methodology documentation is always available at https://documentation.replicahq.com/, and we will continue to update this.
Q: Where does the tourist data come from? How is it adjusted by teams, accommodations, and historic transit usage?
A: Tourist inflow estimates are based on hotel, short-term rental, air travel, and historical major event trends—including past transit shares. We’re also incorporating forecasts tied to team draw and venue proximity; we’ll keep this group posted as these considerations evolve.
Analyses Replica Enables
With Replica data, it's possible to answer new questions about scenario planning

Large-Scale and Small-Scale Event Planning

Major Infrastructure Updates

Safety and
Construction Planning
